Graphs
When Your Case Is On The Line
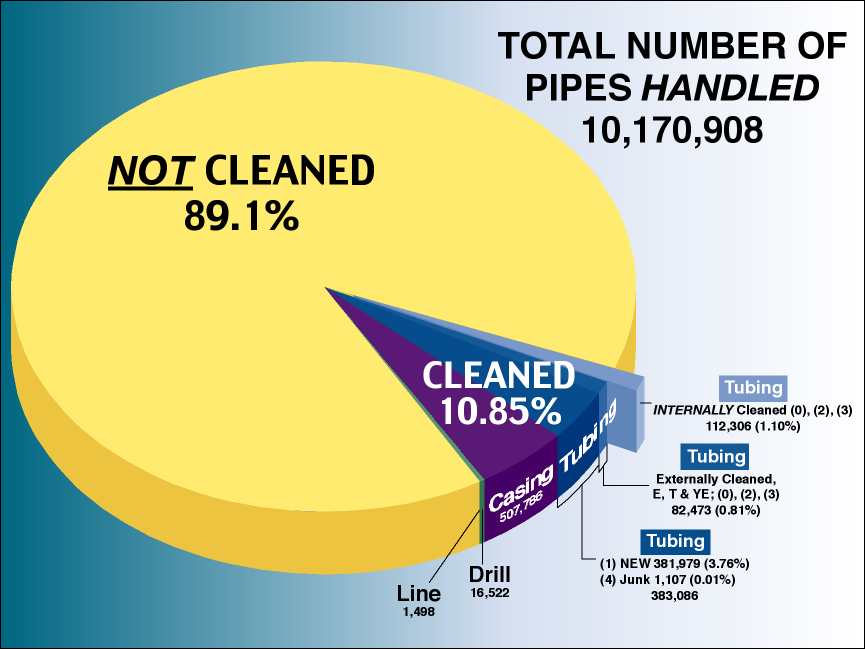
Number of Pipes Handled
A pie chart shows that of the 10 million pipes that were handled in the pipe yard, only 11% were actually cleaned.
Pipe Cleaned
An exploded view of the cleaned pipes data shows the viewer a breakdown by the type of pipes divided by the actual number of work days.
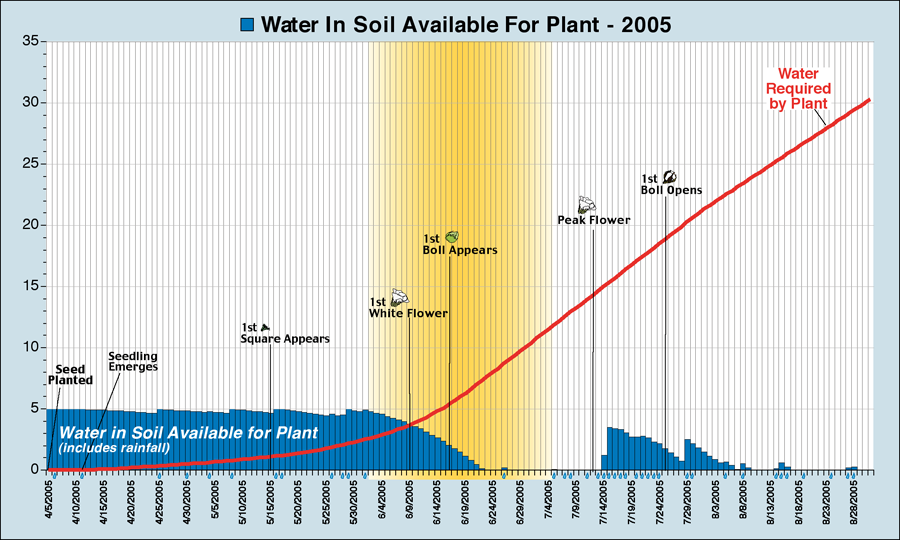
Cotton Plant Water Usage
By layering multiple types of data, we're able to show how much water a cotton plant needs at any point during it's growth cycle, when rain water was deposited, and when the heat wave occurred. Once all these are shown together, it's easy to see why the cotton plants underperformed.
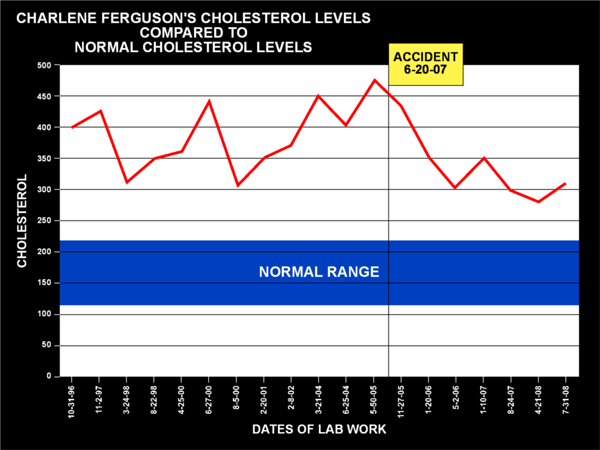
Data v. Normal Range
Comparing Data to a Normal range can often have a dramatic impact when presented in a visual format.